Legend
Who is this for?
Agriculture
This tool can help farmers and other agricultural decision makers in selecting land based on suitability for agriculture.
Planning
This tool can help regional and town planners to identify areas of potentially higher agricultural production values to take into consideration when making zoning decisions in relation to urban development.
Community
There is a great community interest in the concept of reducing 'food miles' both in terms of reducing the environmental impact of food transportation as well as providing the community access to the freshest local food. This will happen with better town planning practices through the use of the index.
Environment
Approaching the management of resources such as water supplies, groundwater, wetlands, native flora and fauna require a better understanding of all the complicated factors, such as urban sprawl, competing economic interests and pollution.
Why is this important?
With increasing populations and urban sprawl there are concerns that prime agricultural land is being overtaken by urban development. This poses many problems including:
- Risks to food security as suitable land for agriculture becomes unavailable forcing agriculture into areas that are less ideal.
- When less ideal land is used for agriculture such as into areas of lower rainfall or poorer soil this creates an increased need for irrigation drawing on limited and precious water supplies (groundwater and rivers) as well as increased need for fertiliser inputs.
- We believe that with future urban planning the value of agricultural land would be better considered so that locations with the best soils and rainfall are preserved as well as considering the importance of reducing food miles and the distance in which the food supply needs to be transported. Likewise this type of modelling can be used to identify the best locations for urban developments on current farmland (where needed) utilising the least valuable locations for agriculture.
Method
The ILI was created using desktop GIS in the open source program QGIS. This index model was created by combining various datasets which were determined through our literature research to be important for agricultural production, water saving (through the best utilisation of the land areas with the most natural rainfall) and the most energy efficient distribution of food (food miles) to urban centres. The land and soil attributes included:
- Organic Carbon
- Electrical conductivity (as this relates to soil salinity)
- Soil pH (and specifically the variance of soil from the ideal 6.5 pH)
- Available Water Capacity
- Average Annual Rainfall
- Distance to the nearest urban centre
Normalised raster layers were created for each of these datasets using Inverse Weighted Distance Interpolation (IWD). The variables were combined in the final ILI model using the following equation and the raster calculator tool in QGIS:
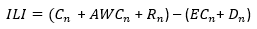 ILI = Innovative Land Index
C(n) = Normalised Organic Carbon
AWC(n) = Normalised Available Water Capacity
R(n) = Normalised Annual Rainfall
EC(n) = Normalised Electrical Conductivity
D(n) = Normalised Distance from Closest Major Urban Centre
This equation was used to equally rank all the contributing variables and doing so in a way that adds the values of the beneficial qualities of land for agriculture (organic carbon, rainfall and available water capacity) and subtracts the values of attributes that are negative with increasing values (distance from urban centres and electrical conductivity/salinity). This produced the ILI raster layer.
Overlaying this is a simplified version of the Planning Zones Victoria layer. This was created by grouping zone categories to the following: Agricultural Zones, Rural Living Zones, Conservation Zones and Built Environment Zones (which represent everything else not covered by the other zones and therefore are urban areas, housing, industrial buildings etc).
For further details on the procedures used in desktop GIS to produce these layers, see the documentation on GitHub.
Location
We chose Ballarat and surrounding areas for several reasons. Our team is from Ballarat, so we have the advantage of local knowledge. Ballarat is one of the major urban areas in Victoria and thus draws on a food from surrounding region, and the area encompasses a diverse range of soil types, and current agricultural land uses. Ballarat is also currently forecast as one of the fastest growing urban centres in Victoria with increasing urban sprawl into farmland areas.
Research & Methodology
The Impacts of Transporting Agriculture
Moving over 80 tonnes of agricultural output throughout Australia is expensive, and distance travelled directly impacts the cost of production. Agricultural sources that are closer to point of distribution or consumption entertain a significant economic advantage. These costs also indirectly impact land values, living costs (rural and urban) and lifestyle choices.
Factors
There are many factors involved with logistics, such as the health and condition of livestock travelling longer distances to point of sale (POS). Competitiveness of agriculture products decreases with distance from port or POS. Indirect costs include increased fuel costs associated with farm machinery, lifestyle (distance education, domestic shopping) and storage (silos, refrigeration).
Total Transport Costs - Paddock to Market/Port
| Product | Road | Rail | Road CO2 (tonnes) |
|---|---|---|---|
| Beef | $572,438,780 | $31,656,477 | 244,082 |
| Grain | $2,149,790,452 | $487,280,313 | 862,184 |
| Pigs | $29,012,052 | 11,156 | |
| Rice | $134,177,281 | 55,437 | |
| Dairy | $881,736,430 | 337,294 | |
| Sugar | $52,245,332 | $9,951,700 | 16,174 |
| Sheep/Goats | $221,773,671 | 85,883 | |
| Cotton | $76,914,483 | $13,259,573 | 36,385 |
| Horticulture | $617,806,580 | 256,295 |
Climate Variability
Farming is a risky business, when considering the weather. Rain can occur as too much, too little or at the wrong time resulting in reduced agriculture output. Urban demand for water is increasing proportionally as our cities expand, placing pressures on the reticulated infrastructure (Rivers, dams and water storages) and groundwater systems. During times of stress, such as the millennium drought, engineered solutions result in the construction of desalination plants and groundwater bore construction.
ReferenceFactors
Agriculture is the largest consumer of water, accounting for over 52%, water supply (sewerage, drainage and domestic supply) used 42% and 5% for manufacturing industry.
As the urban population continues to increase, the demand by agriculture industry to supply the needs of urban sprawl will also grow.
This will impact on the designated land use, conservation of wetlands and groundwater systems2.
What is AWC?
Available Water Capacity (AWC) it the water within the soil profile available for plant use. Usually expressed as volume fraction, percentage of a depth. It is a combination of:
- Rainfall infiltration (percentage)
- Soil storage capacity
- Field capacity - maximum water retention after saturation and allowed to drain for one or two days
- Permanent Plant wilting point - plants are no longer able to extract water from the soil resulting in permanent wilting
Uses of AWC in the Index
- To develop water budgets
- Predict susceptibility to droughts
- Irrigation system design
- Protect water resources
- Predict yields
Soil pH
What is Soil pH?
The pH (potential hydrogen) is a measure of the acidity or alkalinity with in the soil medium, which includes water, organic matter and mineral content.
- less than 7 is acidic (i.e. orange juice = pH 3)
- 7 is neutral (i.e. pure water = pH 7)
- greater than 7 is alkaline (i.e. baking soda = pH 9)
Understanding and managing soil pH is important to ensure long term sustainability of agriculture. This helps to maintain soil physical, chemical and biological properties.
Use in the Index
Soil pH affects the soil’s physical, chemical and biological
properties and processes, as well as plant growth. The nutrition,
growth, and yields of most crops decrease where pH is low and
increases as pH rises to an optimum level.
Reference
Crop yield values accociated with pH
| pH | |||||
|---|---|---|---|---|---|
| Crop | 4.7 | 5.0 | 5.7 | 6.8 | 7.5 |
| Corn | 34 | 73 | 83 | 100 | 85 |
| Wheat | 68 | 78 | 89 | 100 | 99 |
| Oats | 77 | 93 | 99 | 98 | 100 |
| Barley | 0 | 23 | 80 | 95 | 100 |
| Alfalfa | 2 | 9 | 42 | 100 | 100 |
| Soybean | 65 | 79 | 80 | 100 | 93 |
What is Soil EC?
All soils have salts present that provide some level of electrical conductivity (EC) that is measured in deci-siemens per meter (dS/m) . As levels of soluble salts increase in the soil, the ability of the roots zone of plants to absorb water and nutrients, decreases. Different plants tolerate varying levels of salinity. This tolerance is measured using the ‘saturated extract method’ (ECe) . A conversion factor is used to convert from EC to ECe (see table).
Use
Low salinity is not necessarily preferable. Some plants (and ecosystems) prefer higher salinity levels!
| Salinity Rating | ECe (dS/m) | Plant / Crop |
|---|---|---|
| Very Low | < 1.8 | All pastures and clovers |
| Low | 1.8 - 3.8 | Most pastures, crops, legumes |
| Moderate | 3.8 - 6.5 | Grass, some legumes |
| High | 6.5 - 8.6 | Grass, not clovers |
| Extreme | > 8.6 | Salt tolerant plants, some barley grass |
Total Organic Carbon
Carbon can be stored in the soil as organic matter, (soil organic carbon-SOC) which is the decomposition of plant and animal matter, and micro-organisms. SOC is the main source of energy for soil micro-organisms1. Increasing soil organic carbon storage in agricultural soils through changes to management may help to mitigate rising greenhouse gas emissions and sustain agricultural productivity and environmental conditions2.
Factors
SOC affects plant growth as a source of energy, aids mineral uptake for plants, and influences water retention within the soil. Organic acids (e.g., oxalic acid), released during decomposition (such as manures) helps in the availability of phosphorous for plant growth. A reduction in SOC can affect soil stability, water infiltration, drainage and airflow.1
Data Sets
FOI - Locality Point - Vicmap Features of Interest
This dataset was used to locate the offical location of the major urban centres of Ballarat, Geelong, Bendigo and Melbourne. Points at these locations were extracted from the dataset and used as 'hubs' for a point distance analysis in desktop GIS to the 1km grid over the study area (created for this project) which measured the distance of each grid point to the nearest urban centre. This provides the minimum relative 'food mile' value for food produced on agricultural land throughout the study area. These distance results were then interpolated using inverse distance weighting and included as a variable within the Innovated Land Index (ILI).
Data SetOpenStreetMap
OpenStreetMap provides the basemap in our demonstration portal of the Innovated Land Index (ILI). This API was also used within desktop GIS during the analysis stage and creation of the ILI to assist in the defining of the study area.
Data SetPlanning Scheme Zones - Vicmap Planning
This dataset was used to understand landuse at a broad level. The dataset was examined within desktop GIS with a subset of the dataset for the project study area. Land zone descriptions were reclassified into the broad categories: Agriculture, Rural Living Zone, Conservation and Built Environment (ie everything else). This was then overlaid over our Innovating Land Index (ILI) to examine how urban areas and the built environment are currently positioned in relation to prime agricultural land.
Data SetVictorian Land Use Information System 2016-2017
This layer was examined in desktop GIS for the specific project study region noting the land use classifications pertaining to agriculture vs built environment. On further investigation it was decided that the Victorian Planning Zoning dataset was more specific for the needs of the project at this demonstration stage. However future expansion of this project would further use this dataset to look at specific types of agricultural crops (eg oilseed crops, vs cereals, vs horticulture) in relation to the land characteristics mapped by the Innovative Land Index (ILI) and the specific needs of these land uses.
Data SetBOM Average Annual Rainfall (Victoria)
The BOM Victorian rainfall grid was visualised as a raster and a subset created for the specific study area as variable layer in the creation of the Innovative Land Index (ILI).
Data SetSoil and Landscape Grid National Soil Attribute Maps - Available Water Capacity (3" resolution) - Release 1
The layer available water capacity 0-5cm is used for this project. A clipped raster was created of this dataset for the study scope including other complimentary datasets in the creation of the Innovative Land Index (ILI).
Data SetAgriculture Victoria Soils API
The quantitative attributes of this dataset (pH top, Organic Carbon top, Electrical Conductivity top) were used. These were extracted from the API to a 1km resolution grid within the project study area and interpolated using inverse distance weighting to create digital soil maps for further analysis as variables within our innovative land index (ILI) along with other complimentary datasets outlined.
Data SetFor further details about the exact methodology of how we calculated this index, please see the documentation.
Limitations
Overview
Our project was completed within the time constraints of GovHack. We identified suitable and available datasets to include in our land index, but due to time limits, we only chose those datasets which we considered to be most important, being soil organic carbon, pH, salinity, distance, average rainfall and average soil water capacity. We were unable to obtain metadata on some of the datasets and were unable to ascertain if the original data had undergone any transformation. Additionally, the datasets had to be converted to raster data, which could affect the accuracy of the final calculated layer. Our team has experience related to agricultural, water and soil data, but the algorithm used for the index is not based on expert consensus and therefore, it should not be relied on in its current form. All variables, derived from source datasets, were included in the calculation with equal rankings. An improved algorithm needs to be developed based on additional research and the consensus of a multi-disciplinary panel of domain experts including a determination of the relative ranking that different variable(s) should play, and any additional variables needed. The project is limited to the area of Ballarat and its surrounds.
Future Projects Development
Innovative Land Index (ILI) has provided a more holistic approach to land valuation and consequentially will influence management decisions for the future. Adopting a holistic systems approach must be the future of environmental management. This method will help to ensure the sustainable use of resources such as soil productivity, water management and environmental protection as urban development continues to expand.
Future Layers
| Cultural | The addition of cultural aspects to land management will preserve ways of life that are spiritually, and emotionally attached to the land. |
| Land Use | Dividing land use which recognizes different cropping regimes, animal husbandry, forestry, different classes of urban sprawl, irrigation and national forests is paramount to ongoing land use management. Effects erosion, infiltration, organic soil content and soil structure. |
| Groundwater | As surface water becomes increasingly drawn upon to meet the needs of growing population, the quantity and quality of groundwater has become a growing concern. The condition of the aquifers that keep the surface environment in balance must be included in land use management. |
| Water Catchment | As farm use becomes more intensive to better supply increasing city expansion, it is very important to maintain the integrity of the supply of water to the surface water catchments and underground replenishment. |
| Crop Values | Cropping using a ‘gut feel’ or based on economic rationalism does not allow for analyzed holistic systems approach, considering such things as transport logistics, soil types and rainfall data. |
| Slope | Highly impacts capability of land for agriculture, it also threatens development of society, urbanisation, and consequently has many different economic implications. Also related to land use, slope directly affects soil erosion, land stability and water runoff/infiltration. |
| Clay | Adding clay to sandy top soil with a clay content less than 5% - can increase productivity by up to 130%. Raising the clay content changes the soil texture class, which increases the capacity for the soil to store water. Soil content such as clay are import considerations when determining land use. |
Implications & Future Directions
This project was developed within the time limitations and shows a glimpse of what would be possible taking the concept further and developing it into a decision support tool for agriculture and urban planners. We suggest that the following steps should be taken to achieve this.
Firstly, a total literature review should be conducted to search for prior work in developing models for including agricultural considerations into urban planning.
Secondly, a multi-disciplinary approach needs to be taken to identify additional data required and to develop an algorithm or model that assigns more justify more accurate loadings/weights to the different variable(s).
We suggest the inclusion of datasets such as slope, wetlands, transport network, processing facilities and groundwater levels as a starting point for further development. There is scope for using predicted rainfall to include climate change scenarios. We also envisage that the project should be extended nation-wide, which would necessitate to federate datasets from various state jurisdictions. Widening the scope to include more datasets and a larger geographic area would provide a tool for decision making at national level.